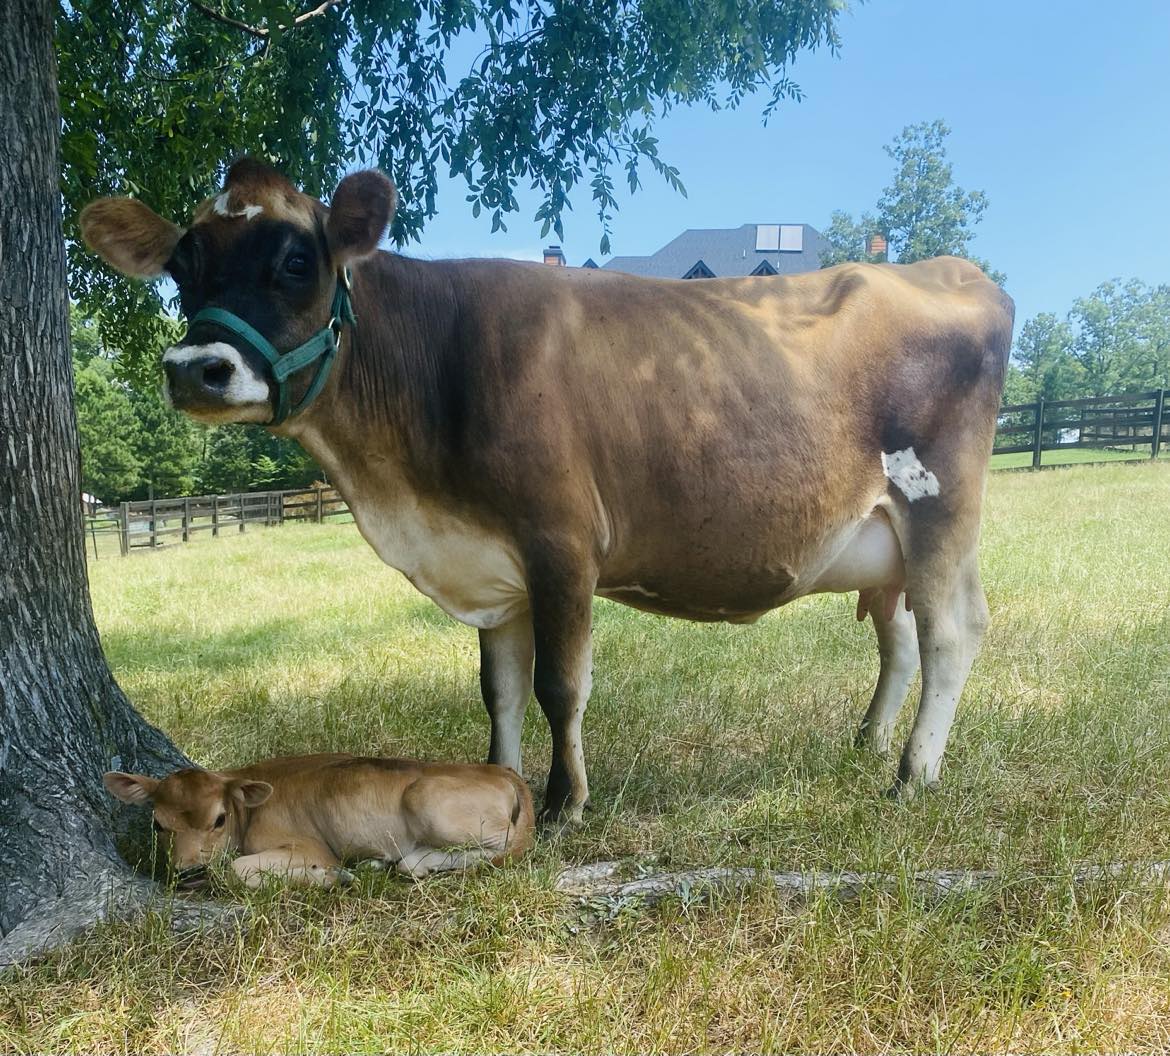
I began my dairy farming adventure with A2/A2 Guernsey and Jersey cattle. However, the financial viability of my small family farm was challenged by the low value and difficulty in selling the calves, as well as the large feed requirements of full-size cows. So, I sought alternatives and discovered Mini Jerseys. They were the spitting image of my favorite cow breed, the Jersey, and produced the same delightfully sweet and creamy milk. The bonus? They ate less and required less land. The clincher was that the sale of the calves could work into my financial plan. I took the plunge!
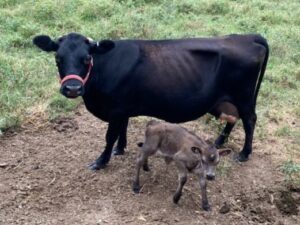
However, the Mini Jerseys I saw online appeared quite diverse in appearance and cost. After months of searching, I found a heifer for sale. She was adorable, albeit she looked more like a Holstein. As long as she was petite, I thought that she would be fine. But, there wasn’t registration information as promised. How could I confirm she was indeed a miniaturized Jersey? I found another heifer further away. She was the wildest animal upon arrival that I have ever owned! She did come with papers, but she seemed to be more likely to be pure Dexter. I researched more about Mini Jerseys and came across a registry that was testing for Jersey purity using Breed Based Representation (BBR) and genomic testing. I was thrilled! Now, I could determine the Jersey percentage in these Mini Jerseys and get to the bottom of my suspicions. My use of genomics and BBR testing began. I was eager to figure out the percentage of Jersey and started growing my Purebred Mini Jersey herd to better Jersey DNA purity.
Once my Purebred Mini Jersey herd was established, I returned to my roots and focused on running a micro-dairy. We sell fresh, raw milk through herd shares and I wanted to boost milk production since it had taken a significant hit when I transitioned from full-size cows to the Mini Jerseys I bought. By looking at their Milk numbers in the Genomic Evaluation Report, I realized that the Yield numbers for Milk varied greatly. However, they seemed to correlate with what I was getting in the bucket. So, a cow was producing well if she scored positive for Milk, very good if -100 to -1200, and not well if -2000 to -3000. But, the size of the animal mattered too. For instance, my 38” cow with a Milk Yield score of 18 peaked at 4 gallons when Once-a-Day milking (OAD). My 43” cow was -790 and also gave me 4 gallons. So, you have to also consider the size and the amount of feed it takes to produce the milk. The other 38” cow I have is -166 for Milk Yield and I expect she will peak at 3 gallons in her third lactation but she won’t hit as high as my other 38” cow because of the difference in genetics, as seen in their scores. This has greatly helped my breeding program because I can increase Milk, Fat, and Protein using the numbers rather than monitoring and testing the milk. Conversely, you could choose to use the scores to selectively breed for less milk production from a very high producer who quickly loses body condition while in milk.
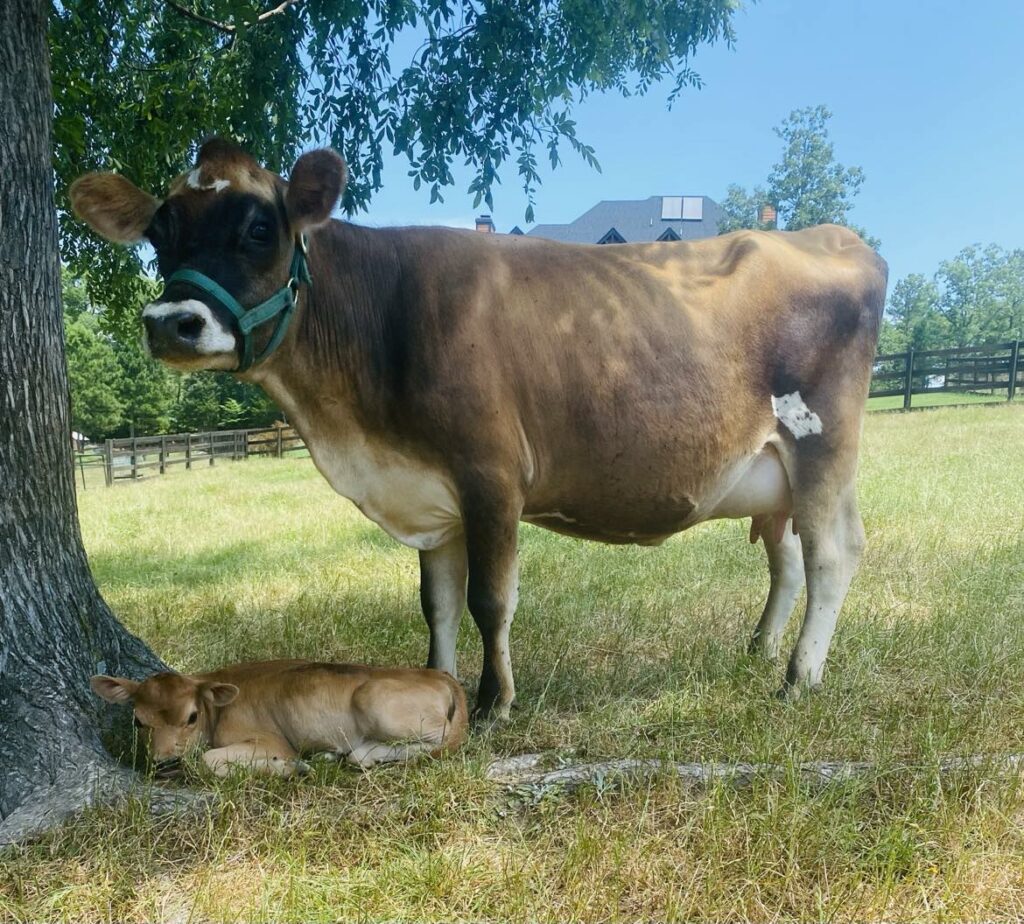
Another crucial number that has greatly influenced my grass-fed rotational program is the Grazing Merit (GM$) Index score. I’ve noticed that those animals that are positive or only -100 hold condition better and if I’m not careful can become over-conditioned and are harder to get pregnant on time. My preference is for the cows that are -200 to -300 as they require less monitoring to maintain weight and are less likely to get over-conditioned. My cows below -400 tend to need extra nutritional support through lactation. So, I have been breeding my strong cows who score well in Strength (SR) with sons from my frail cows who score lower in Strength, and vice-versa, to strike the perfect balance.
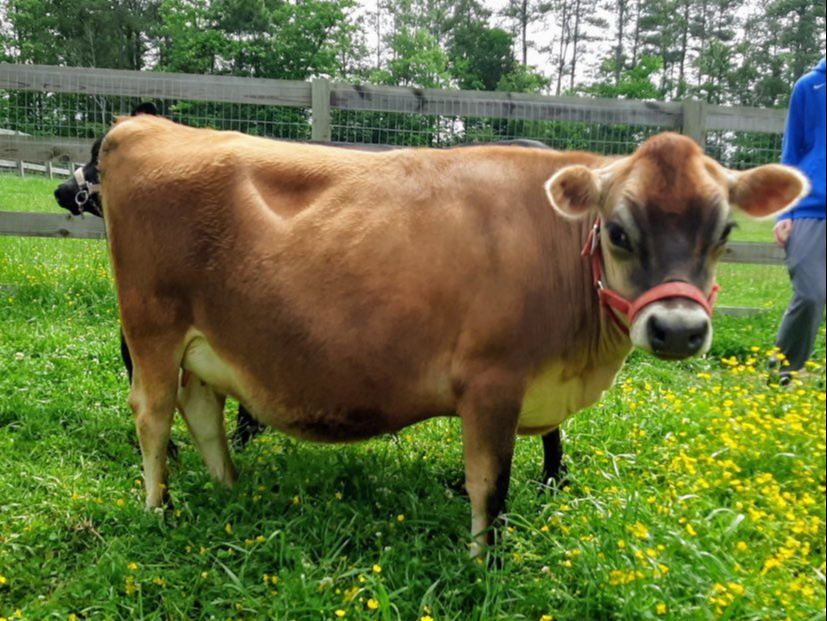
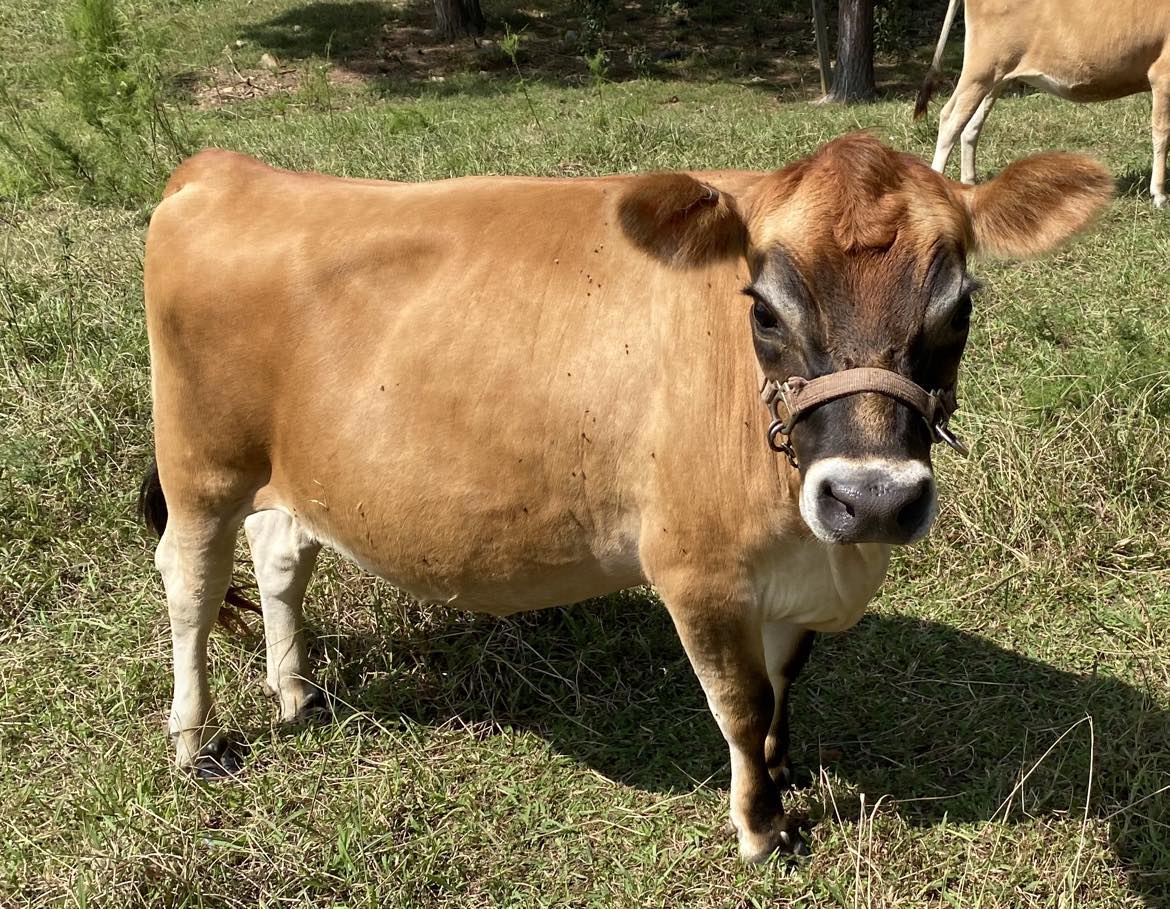
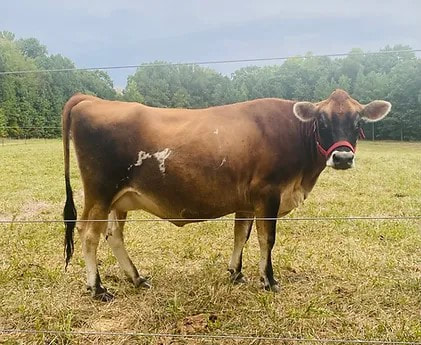
The last area I am working with is the Type. These traits are proving harder to dramatically improve since they’ve had such small fluctuations in the offspring. I’m paying attention to Rear Udder Height (RH), Rear Udder Width (RUW), as well as Udder Depth (UD), but I’m more confident with visual assessment than the Type numbers. I hope in time to figure out a good range for my Purebred Mini Jersey herd.
In conclusion, I’m extremely glad for the results of applying genomic testing to my Purebred Mini Jerseys. Not only does it allow me to prove the Jersey DNA percentage (BBR) in my herd, but it also enables faster improvement in targeted areas, like Milk Yield and Fat, by strategic breeding. Furthermore, I can move towards a sustainable farm with grass-fed genetics using the Grazing Merit numbers. The future looks promising with genomic evaluation testing guiding my journey!
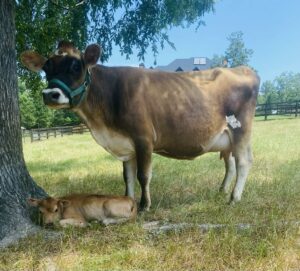
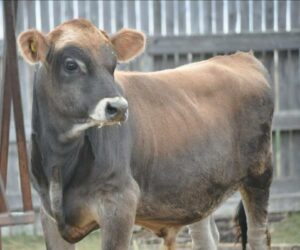

Thank you Sabrina, this has been so helpful for me to learn! I did not know what the Grazing Merit score indicated before reading this, and I can see from our cows’ genomic reports and what we’ve experienced during their lactations that it also correlates for our herd. For eg, our shortest cow has a GM$ score closest to 0 in our herd at -276 and she does tend to get over-conditioned if I don’t keep her dry period short enough. Her half sister is about an inch taller, with a lower GM$ score at -335 and she does not get over-conditioned between lactations! We also boarded one cow who was the tallest of the three, her GM$ score is -427 and we struggled to maintain her condition on grass alone during her lactation.